The number of new daily Covid-19 cases had continued to drop in the most affected regions in Europe and America, with most new cases recorded in Mexico and some South American countries.
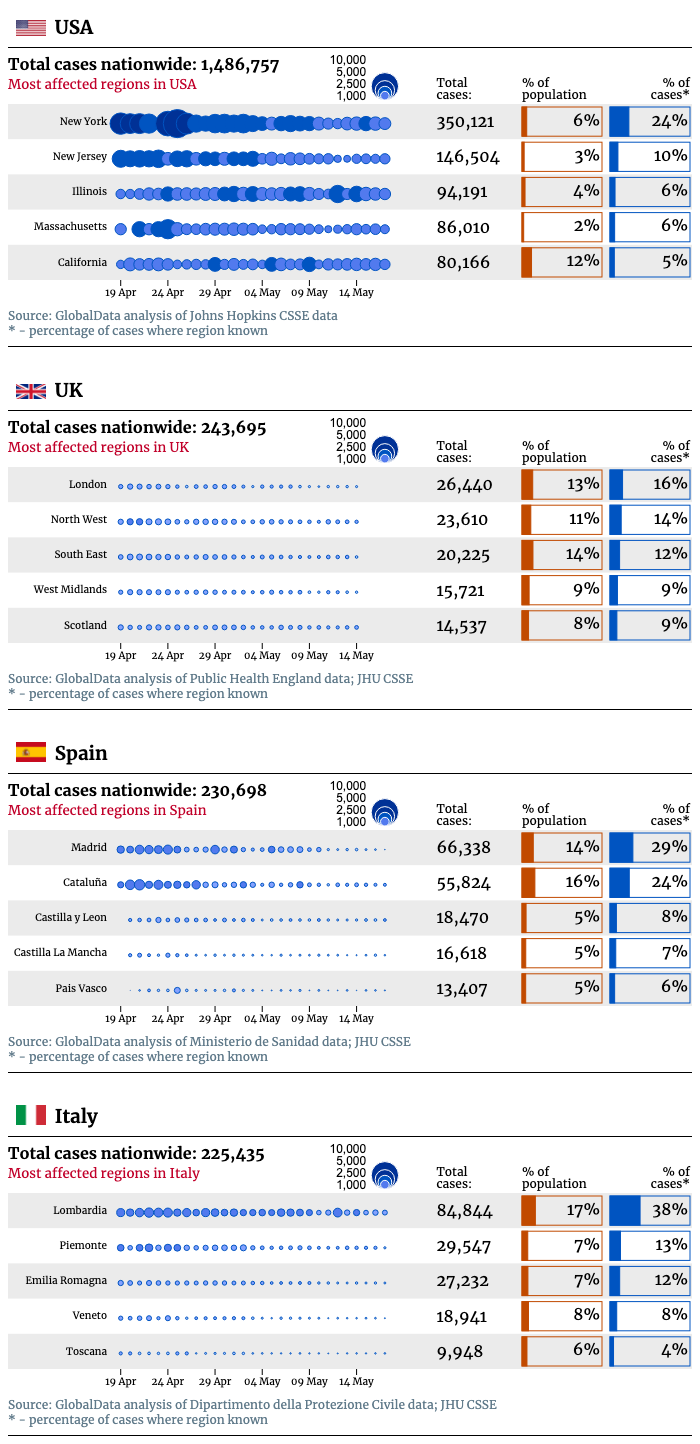
Illinois has overtaken Massachusetts as the third most affected region in the US, with the number of daily new cases there quickly approaching those in New York.
In the UK, where restrictions were slightly eased on May 13, the north west of England has now recorded 23,610 cases of Covid-19 and is set to overtake London as the epicentre of the outbreak.
Lombardy, the most affected region of Italy, has seen more modest decreases in the number of new cases compared to the rest of the country. Italy’s shops and cafes have reopened on Monday after 10 weeks of lockdown.
Madrid has also seen a slight uptick in the proportion of Spain’s new Covid-19 cases.
Monitoring the cities at the heart of the Covid-19 outbreak
Cities – with their high population density, young and mobile demographics, and developed public transport systems – are particularly susceptible to rapidly-spreading viral outbreak. Here we drill down into subnational Covid-19 figures to show which areas are seeing disproportionate numbers of Covid-19 cases.
While different countries count at different administrative levels, the pattern is clear: London and Madrid are “regions” in their own right, while New York State includes New York City and Lombardy covers Milan. This chart is currently being updated weekly with the latest figures – although some countries have a slight delay in publishing the very latest case numbers by region or state.