Since the general election, experts have been wondering how the pollsters got their prediction so wrong. While they focus on polling problems and methodology, we have explored human geography fundamentals. Interestingly, we find that there is a correlation between voter preference and population density.
In order to undertake this analysis, we have analysed the vote share from the 2015 general election for both the Conservative and Labour Parties across every constituency and plotted this against the population density (taken from the 2011 Census). Unsurprisingly, two things jump out. First, there appears to be a positive correlation between population density and vote share. But secondly, this correlation is by no means a perfect fit – constituencies are complex geographies with a variety of different and competing pressures located within them.
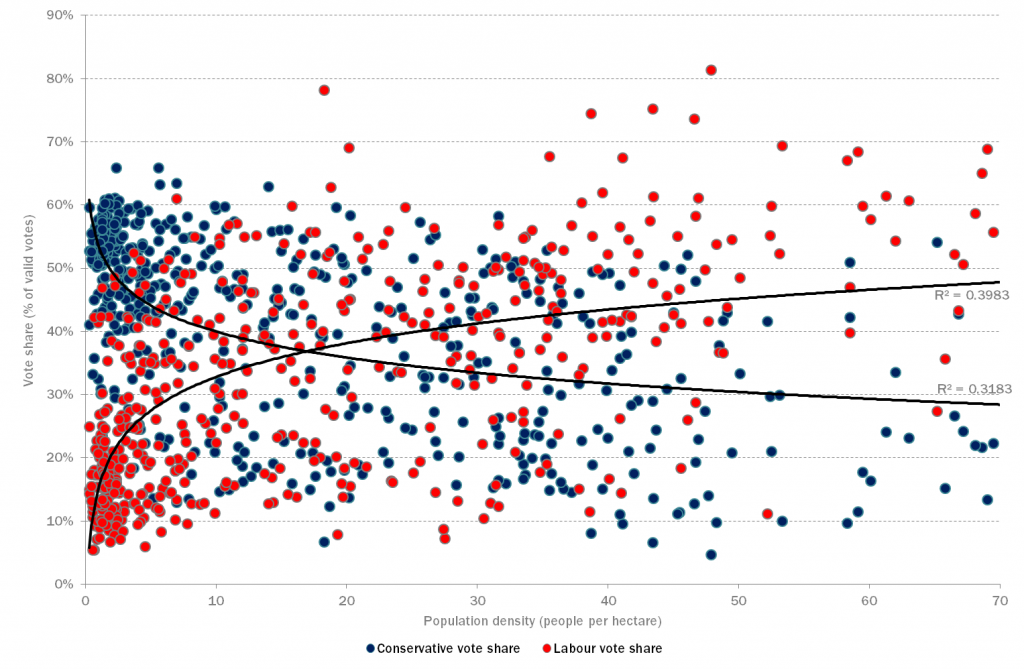
Vote share and population density. Source: Electoral Commission, ONS, NLP analysis.
In order to simplify this analysis, a trend line has been added (a logarithmic one, as it best represents the data). This trend line provides an equation which we can use as a model for both Labour and Conservative vote share and population density.
Indeed, the two models seem to work quite successfully – using both models to predict the vote share given a particular population density, and comparing the result with the real result in the election, the models correctly predict the party with the largest vote share three quarters of the time.

Smoothed vote share proportion and population density. Source: NLP analysis.
Of course, a lot of this analysis simply reaffirms what we could already predict – Labour does well in higher density urban areas while the Conservatives do well in lower density shires. However, the real interest lies in the intersection at which the vote share is so close – around a density of 16-17 people per hectare.
Constituencies with population densities around this crossover point include the key marginal seats of Bury North, Lincoln, Stevenage, Telford, Thurrock and Wirral West. Moreover, of the 32 constituencies near to this modelled crossover point, 24 have Green Belt land located within them, accounting for 52 per cent of their combined land area.
What will be interesting is to see is how influential Green Belt policy and/or associated housing pressures and requirements will be on the local politics of these constrained areas – are these places more likely than other areas to foster a productive conversation about the policy choices over how to plan for housing? Or are they perhaps less?
Joe Sarling is associate director of the planning consultancy Nathanial Lichfield & Partners. This article was originally posted on the firm’s blog.


